Պատկեր:Kinked demand.svg

Size of this PNG preview of this SVG file: 580 × 480 պիքսել. Այլ թույլտվությաններ: 290 × 240 պիքսել | 928 × 768 պիքսել | 1237 × 1024 պիքսել | 2475 × 2048 պիքսել.
Սկզբնական նիշք (SVG-նիշք, անվանապես 580 × 480 փիքսել, նիշքի չափը՝ 2 ԿԲ)

|
Այս SVG ֆայլ օգտագործում է զետեղված տեքստ, որը կարելի է հեշտ թարգմանել ձեր լեզվի վրա using [toolforge:svgtranslate/File:Kinked_demand.svglink this automated tool]: Իմացեք ավելին: You can also download it and translate it manually using a text editor. |
| Նկարագրում |
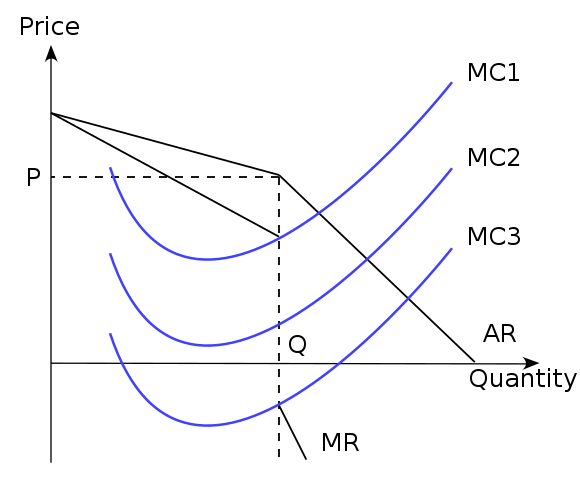
English: A diagram illustrating kinked demand, one formulation for explaining price stability in oligopolies. The demand curve the oligopolist faces is that of two separate curves spliced together, creating a discontinuity in the MR curve. This means that a profit maximising firm will still produce at quantity Q and price P if marginal costs are equal to MC1, MC2 or MC3, thus explaining price stability. (Here, both curves are illustrated as linear, though the concept would work exactly the same if they were not.) |
| Թվական | (UTC) |
| Աղբյուր | |
| Հեղինակ |
|
Այս նիշքը հասանելի է Creative Commons Attribution-Share Alike 3.0 Unported արտոնագրի ներքո:
- Դուք ազատ եք՝
- կիսվել ստեղծագործությամբ – պատճենել, տարածել և փոխանցել այս աշխատանքը։
- վերափոխել – ադապտացնել աշխատանքը
- Պահպանելով հետևյալ պայմանները'
- հղում – Դուք պետք է նշեք հեղինակի (իրավատիրոջ) հղումը:
- համանման տարածում – Եթե դուք ձևափոխում եք, փոխակերպում, կամ այս աշխատանքի հիման վրա ստեղծում եք նոր աշխատանք, ապա ձեր ստեղծածը կարող է տարածվել միայն նույն կամ համարժեք թույլատրագրով։
Original upload log
This image is a derivative work of the following images:
- File:Perfect_competition_in_the_short_run.svg licensed with Cc-by-sa-3.0
- 2010-10-15T16:18:39Z Jarry1250 580x400 (2908 Bytes) == int:filedesc == == int:filedesc == Better economics
- 2010-10-05T20:59:03Z Jarry1250 560x400 (3824 Bytes) == Summary == Economics error fixed.
- 2010-10-05T20:52:52Z Jarry1250 560x400 (3823 Bytes) == Summary == Try to realign again.
- 2010-10-05T20:51:10Z Jarry1250 560x400 (3823 Bytes) == Summary == == Summary == Minor fixes
- 2010-10-05T20:45:52Z Jarry1250 560x400 (3803 Bytes) {{Information |Description={{en|Diagram showing that it is possible that a firm in [[:en:perfect competition|]] makes an [[:en:Economic profit|abnormal profit]], if P > min(ATC). In the [[:en:long run|]], however, only normal
Uploaded with derivativeFX
Նիշքի պատմություն
Մատնահարեք օրվան/ժամին՝ նիշքի այդ պահին տեսքը դիտելու համար։
| Օր/Ժամ | Մանրապատկեր | Օբյեկտի չափը | Մասնակից | Մեկնաբանություն | |
|---|---|---|---|---|---|
| ընթացիկ | 19:40, 1 հունվարի 2011 | | 580 × 480 (2 ԿԲ) | Jarry1250 | {{Translation possible}} {{Information |Description={{en|A diagram illustrating en:kinked demand, one formulation for explaining price stability in oligopolies. The demand curve the oligopolist faces is that of two separate curves |
Նիշքի օգտագործում
Հետևյալ էջը հղվում է այս նիշքին՝
Նիշքի համընդհանուր օգտագործում
Հետևյալ այլ վիքիները օգտագործում են այս նիշքը՝
- Օգտագործումը en.wikipedia.org կայքում
- Օգտագործումը fr.wikipedia.org կայքում
- Օգտագործումը kn.wikipedia.org կայքում
- Օգտագործումը ru.wikipedia.org կայքում