Պատկեր:ArcticYearlongTempAnom HR.jpg
Նախադիտման չափ՝ 571 × 600 պիքսել։ Այլ թույլտվությաններ: 228 × 240 պիքսել | 457 × 480 պիքսել | 731 × 768 պիքսել | 975 × 1024 պիքսել | 1439 × 1512 պիքսել.
Սկզբնական նիշք (1439 × 1512 փիքսել, նիշքի չափը՝ 1,1 ՄԲ, MIME-տեսակը՝ image/jpeg)
Ամփոփում
| Նկարագրում |
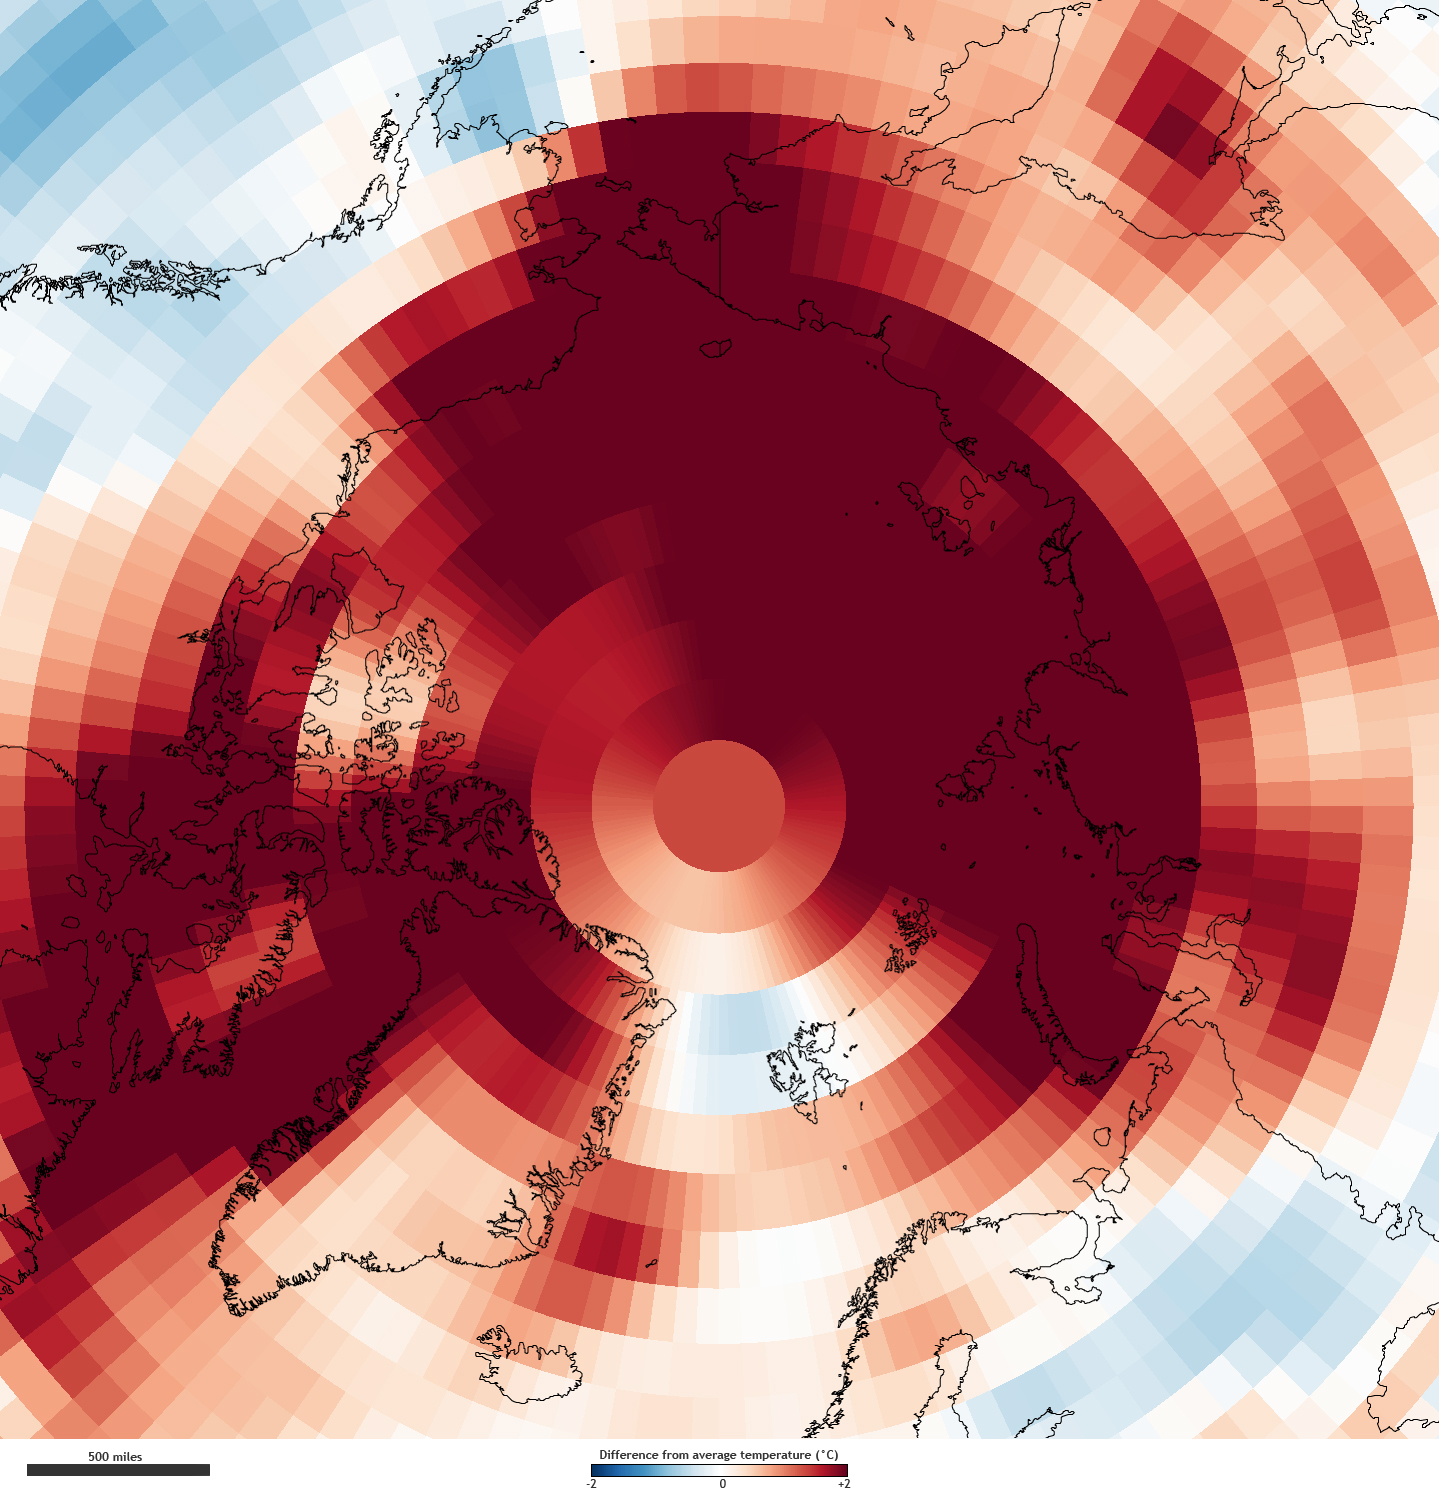
English: The image shows where average air temperatures (October 2010-September 2011) were between 2 degrees Celsius above (red) or below (blue) the long-term average (1981-2010). The map is based on a NCEP/NCAR reanalysis of near-surface air temperature anomalies provided by NOAA’s Earth System Research Laboratory’s Physical Sciences Division. |
| Թվական | |
| Աղբյուր | http://www.climatewatch.noaa.gov/wp-content/uploads/2011/12/ArcticYearlongTempAnom_HR.jpg |
| Հեղինակ | Hunter Allen and Richard Rivera (NOAA’s Climate Program Office)http://www.climatewatch.noaa.gov/article/2011/arctic-warming-exceeds-global-average |
Արտոնագրում
This image is in the public domain because it contains materials that originally came from the U.S. National Oceanic and Atmospheric Administration, taken or made as part of an employee's official duties.
|

|
Այս ֆայլի կատեգորիաները ենթակա են ստուգման: Ստուգեք դրանք հիմա:
|
Նիշքի պատմություն
Մատնահարեք օրվան/ժամին՝ նիշքի այդ պահին տեսքը դիտելու համար։
| Օր/Ժամ | Մանրապատկեր | Օբյեկտի չափը | Մասնակից | Մեկնաբանություն | |
|---|---|---|---|---|---|
| ընթացիկ | 16:44, 6 Դեկտեմբերի 2011 | | 1439 × 1512 (1,1 ՄԲ) | Sagredo |
Նիշքի օգտագործում
Հետևյալ 2 էջերը հղվում են այս նիշքին՝
Նիշքի համընդհանուր օգտագործում
Հետևյալ այլ վիքիները օգտագործում են այս նիշքը՝
- Օգտագործումը cs.wikipedia.org կայքում
- Օգտագործումը en.wikipedia.org կայքում
- Օգտագործումը es.wikipedia.org կայքում
- Օգտագործումը fr.wikipedia.org կայքում
- Օգտագործումը id.wikipedia.org կայքում
- Օգտագործումը mk.wikipedia.org կայքում
- Օգտագործումը nl.wikipedia.org կայքում
- Օգտագործումը ru.wikipedia.org կայքում
- Օգտագործումը zh.wikipedia.org կայքում