Պատկեր:Top Oil Producing Countries.png

Նախադիտման չափ՝ 551 × 600 պիքսել։ Այլ թույլտվությաններ: 221 × 240 պիքսել | 441 × 480 պիքսել | 681 × 741 պիքսել.
Սկզբնական նիշք (681 × 741 փիքսել, նիշքի չափը՝ 28 ԿԲ, MIME-տեսակը՝ image/png)
Ամփոփում
| Նկարագրում |
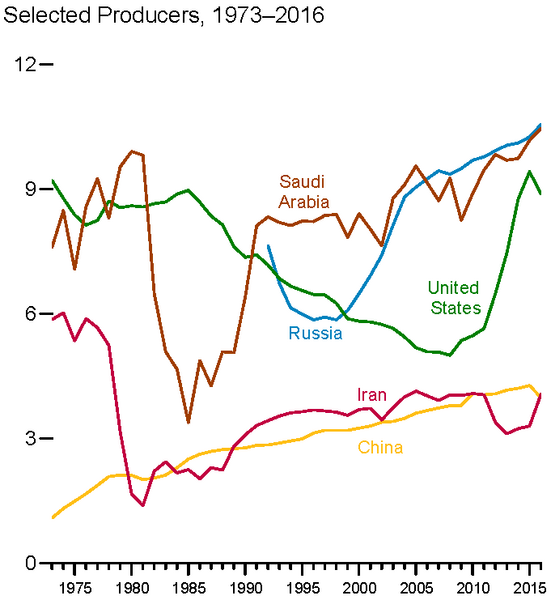
Top Oil-Producing Countries (Crude Oil including Gas Condensate, million barrels per day, 1973–2016) |
||
| Թվական | |||
| Աղբյուր | https://www.eia.gov/totalenergy/data/monthly/archive/00351705.pdf (Monthly Energy Review, May 2017, Figure 11.1a) | ||
| Հեղինակ | U.S. Energy Information Administration | ||
| Այլ մեկնակերպներ |
Chart based on https://www.eia.gov/totalenergy/data/monthly/archive/00351705.pdf (Monthly Energy Review, May 2017, Table 11.1a): Note that the graph has less data than the PNG image for the years 1973-1995. The later years should be identical. |

Արտոնագրում
| This image is a work of a United States Department of Energy (or predecessor organization) employee, taken or made as part of that person's official duties. As a work of the U.S. federal government, the image is in the public domain.
Please note that national laboratories operate under varying licences and some are not free. Check the site policies of any national lab before crediting it with this tag.
|

|
Նիշքի պատմություն
Մատնահարեք օրվան/ժամին՝ նիշքի այդ պահին տեսքը դիտելու համար։
| Օր/Ժամ | Մանրապատկեր | Օբյեկտի չափը | Մասնակից | Մեկնաբանություն | |
|---|---|---|---|---|---|
| ընթացիկ | 23:01, 28 Մայիսի 2017 | | 681 × 741 (28 ԿԲ) | Patrug | another year of data |
| 18:41, 1 Մայիսի 2016 |  | 701 × 753 (27 ԿԲ) | Patrug | another year of data | |
| 00:07, 6 Դեկտեմբերի 2015 |  | 677 × 734 (26 ԿԲ) | Patrug | 9 years of newer data | |
| 19:24, 26 հունվարի 2008 |  | 465 × 472 (32 ԿԲ) | Halgin | {{Information |Description= Top Oil Producing Counties 1960-2006 |Source= Energy Information Administration / Annual Energy Review 2006 |Date= July 2007 |Author= US Department of Energy, Energy Information Administration |Permission= |other_versions= }} |
Նիշքի օգտագործում
Հետևյալ էջը հղվում է այս նիշքին՝
Նիշքի համընդհանուր օգտագործում
Հետևյալ այլ վիքիները օգտագործում են այս նիշքը՝
- Օգտագործումը ar.wikipedia.org կայքում
- Օգտագործումը ca.wikipedia.org կայքում
- Օգտագործումը cs.wikipedia.org կայքում
- Օգտագործումը el.wikipedia.org կայքում
- Օգտագործումը en.wikipedia.org կայքում
- Օգտագործումը en.wikibooks.org կայքում
- Օգտագործումը eo.wikipedia.org կայքում
- Օգտագործումը es.wikipedia.org կայքում
- Օգտագործումը eu.wikipedia.org կայքում
- Օգտագործումը fa.wikipedia.org կայքում
- Օգտագործումը fi.wikipedia.org կայքում
- Օգտագործումը id.wikipedia.org կայքում
- Օգտագործումը kk.wikipedia.org կայքում
- Օգտագործումը ko.wikipedia.org կայքում
- Օգտագործումը ml.wikipedia.org կայքում
- Օգտագործումը ms.wikipedia.org կայքում
- Օգտագործումը my.wikipedia.org կայքում
- Օգտագործումը ne.wikipedia.org կայքում
- Օգտագործումը pl.wikipedia.org կայքում
- Օգտագործումը pl.wiktionary.org կայքում
- Օգտագործումը pt.wikipedia.org կայքում
- Օգտագործումը ru.wikipedia.org կայքում
- Օգտագործումը simple.wikipedia.org կայքում
- Օգտագործումը sl.wikipedia.org կայքում
- Օգտագործումը th.wikipedia.org կայքում
- Օգտագործումը tr.wikipedia.org կայքում
- Օգտագործումը uk.wikipedia.org կայքում
- Օգտագործումը uz.wikipedia.org կայքում
- Օգտագործումը vec.wikipedia.org կայքում
- Օգտագործումը vi.wikipedia.org կայքում
- Օգտագործումը www.wikidata.org կայքում
- Օգտագործումը zh.wikipedia.org կայքում
Տեսնել այս նիշքի ավելի համընդհանուր օգտագործումը: