Պատկեր:RiemannCriticalLine.svg

Size of this PNG preview of this SVG file: 800 × 372 պիքսել. Այլ թույլտվությաններ: 320 × 149 պիքսել | 640 × 298 պիքսել | 1024 × 476 պիքսել | 1280 × 595 պիքսել | 2560 × 1191 պիքսել | 933 × 434 պիքսել.
Սկզբնական նիշք (SVG-նիշք, անվանապես 933 × 434 փիքսել, նիշքի չափը՝ 50 ԿԲ)
W3C-validity not checked.
Ամփոփում
| Նկարագրում |
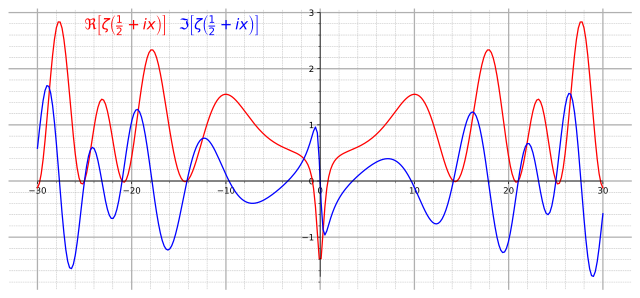
English: Graph of real (red) and imaginary (blue) parts of the critical line Re(z)=1/2 of the Riemann zeta function. |
||
| Թվական | |||
| Աղբյուր |
Own work. Made with Mathematica using the following code: Show[Plot[{Re[Zeta[1/2+I x]], Im[Zeta[1/2+I x]]}, {x,-30, 30},AxesLabel->{"x"} , PlotStyle->{Red, Blue}, Ticks->{Table[4x-28,{x,0,14}]}, ImageSize->{800,600}],
Graphics[Text[Style[\[DoubleStruckCapitalR][\[Zeta][ I x + "1/2"]],14,Red ,Background ->White],{-22,2.6} ]],
Graphics[Text[Style[\[GothicCapitalI][\[Zeta][ I x + "1/2"]],14,Blue ,Background ->White],{-14,2.6} ]]] |
||
| Հեղինակ | Slonzor | ||
| Իրավունքներ (Նիշքի վերաօգտագործումը) |
Public Domain | ||
| SVG genesis | Այս մասշտաբավորելի վեկտորային գրաֆիկայի նիշքի ելակետային կոդը վավեր է. | ||
| Ելակետային կոդ | Python code
|
Արտոնագրում
| I, the copyright holder of this work, release this work into the public domain. This applies worldwide. In some countries this may not be legally possible; if so: I grant anyone the right to use this work for any purpose, without any conditions, unless such conditions are required by law. |
Նիշքի պատմություն
Մատնահարեք օրվան/ժամին՝ նիշքի այդ պահին տեսքը դիտելու համար։
| Օր/Ժամ | Մանրապատկեր | Օբյեկտի չափը | Մասնակից | Մեկնաբանություն | |
|---|---|---|---|---|---|
| ընթացիկ | 20:01, 23 Օգոստոսի 2017 | | 933 × 434 (50 ԿԲ) | Krishnavedala | much reduced vector version |
| 22:28, 24 Սեպտեմբերի 2009 |  | 800 × 600 (122 ԿԲ) | Geek3 | linewidth=1px | |
| 19:33, 20 Նոյեմբերի 2008 |  | 800 × 600 (122 ԿԲ) | Slonzor | Man i've messed this up a lot of times. | |
| 19:27, 20 Նոյեմբերի 2008 |  | 800 × 600 (3,36 ՄԲ) | Slonzor | ||
| 19:23, 20 Նոյեմբերի 2008 |  | 800 × 600 (3,36 ՄԲ) | Slonzor | ||
| 19:18, 20 Նոյեմբերի 2008 |  | 800 × 600 (3,36 ՄԲ) | Slonzor | ||
| 19:13, 20 Նոյեմբերի 2008 |  | 800 × 600 (79 ԿԲ) | Slonzor | {{Information |Description={{en|1=Graph of real (red) and imaginary (blue) parts of the critical line Re(z)=1/2 of the Riemann zeta function.}} |Source=Own work. Made with Mathematica using the following code: <code><nowiki>Show[Plot[{Re[Zeta[1/2+I x]], |
Նիշքի օգտագործում
Հետևյալ էջը հղվում է այս նիշքին՝
Նիշքի համընդհանուր օգտագործում
Հետևյալ այլ վիքիները օգտագործում են այս նիշքը՝
- Օգտագործումը ar.wikipedia.org կայքում
- Օգտագործումը ba.wikipedia.org կայքում
- Օգտագործումը be.wikipedia.org կայքում
- Օգտագործումը ca.wikipedia.org կայքում
- Օգտագործումը ckb.wikipedia.org կայքում
- Օգտագործումը da.wikipedia.org կայքում
- Օգտագործումը el.wikipedia.org կայքում
- Օգտագործումը en.wikipedia.org կայքում
- Օգտագործումը eo.wikipedia.org կայքում
- Օգտագործումը eu.wikipedia.org կայքում
- Օգտագործումը fa.wikipedia.org կայքում
- Օգտագործումը fi.wikipedia.org կայքում
- Օգտագործումը he.wikipedia.org կայքում
- Օգտագործումը hi.wikipedia.org կայքում
- Օգտագործումը id.wikipedia.org կայքում
- Օգտագործումը it.wikipedia.org կայքում
- Օգտագործումը it.wikiquote.org կայքում
- Օգտագործումը ja.wikipedia.org կայքում
- Օգտագործումը ko.wikipedia.org կայքում
- Օգտագործումը la.wikipedia.org կայքում
- Օգտագործումը mn.wikipedia.org կայքում
- Օգտագործումը nn.wikipedia.org կայքում
- Օգտագործումը no.wikipedia.org կայքում
- Օգտագործումը pa.wikipedia.org կայքում
- Օգտագործումը pt.wikipedia.org կայքում
- Օգտագործումը ru.wikipedia.org կայքում
- Օգտագործումը sl.wikipedia.org կայքում
- Օգտագործումը sq.wikipedia.org կայքում
- Օգտագործումը sr.wikipedia.org կայքում
- Օգտագործումը uk.wikipedia.org կայքում
- Օգտագործումը vi.wikipedia.org կայքում
- Օգտագործումը zh-yue.wikipedia.org կայքում
- Օգտագործումը zh.wikipedia.org կայքում
Տեսնել այս նիշքի ավելի համընդհանուր օգտագործումը: