Պատկեր:Pie chart of lung cancers.svg

Size of this PNG preview of this SVG file: 482 × 368 պիքսել. Այլ թույլտվությաններ: 315 × 240 պիքսել | 629 × 480 պիքսել | 1006 × 768 պիքսել | 1280 × 977 պիքսել | 2560 × 1955 պիքսել.
Սկզբնական նիշք (SVG-նիշք, անվանապես 482 × 368 փիքսել, նիշքի չափը՝ 18 ԿԲ)
Ամփոփում
| Նկարագրում |
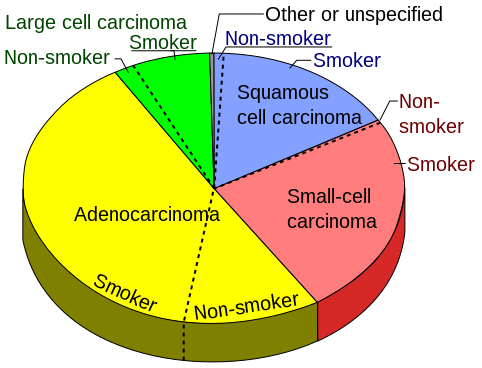
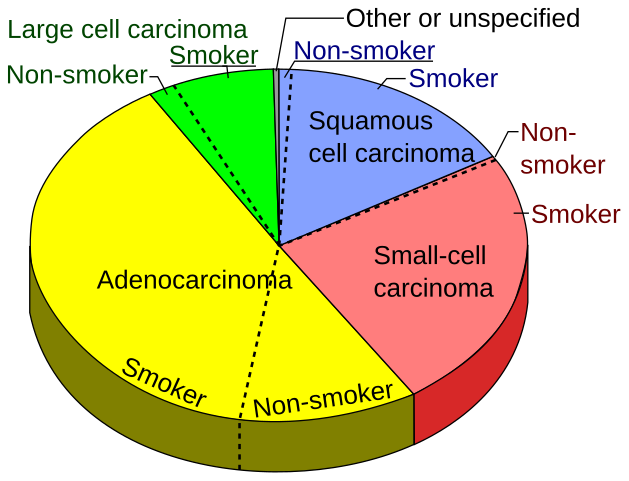
English: Pie chart of the incidence of lung cancer types, sorted by histological subtypes, in turn sorted into how many are non-smokers versus smokers - defined as current or former smoker of more than 1 year of duration according to:
Raw data: coon-smoker: 0,3% Small Cell Carcinoma - smoker: 24,0% Adenocarcinoma - non-smoker: 11,6% Adenocarcinoma - smoker: 38,9% Large Cell Carcinoma - non-smoker: 1,5% Large Cell Carcinoma - smoker: 6,7% Other or unspecified: 0,4%. |
| Թվական | |
| Աղբյուր | Բեռնողի սեփական աշխատանք |
| Հեղինակ |
When using this image in external works, it may be cited as:
or
|
Արտոնագրում
Ես, սույն աշխատանքի հեղինակային իրավունքների տերը, այսուհետ այն հրատարակում եմ հետևյալ արտոնագրի ներքո։
| This file is made available under the Creative Commons CC0 1.0 Universal Public Domain Dedication. | |
| The person who associated a work with this deed has dedicated the work to the public domain by waiving all of their rights to the work worldwide under copyright law, including all related and neighboring rights, to the extent allowed by law. You can copy, modify, distribute and perform the work, even for commercial purposes, all without asking permission.
|
Նիշքի պատմություն
Մատնահարեք օրվան/ժամին՝ նիշքի այդ պահին տեսքը դիտելու համար։
| Օր/Ժամ | Մանրապատկեր | Օբյեկտի չափը | Մասնակից | Մեկնաբանություն | |
|---|---|---|---|---|---|
| ընթացիկ | 16:05, 6 Մարտի 2019 | | 482 × 368 (18 ԿԲ) | David.haberthuer | Reverted to version as of 16:35, 10 June 2011 (UTC) |
| 15:56, 6 Մարտի 2019 |  | 1143 × 644 (27 ԿԲ) | David.haberthuer | Redrawn with matplotlib in Python. The full drawing is done in this Jupyter notebook: https://github.com/habi/wikipedia-plots/blob/master/Cancer%20pie%20chart.ipynb | |
| 16:35, 10 Հունիսի 2011 |  | 482 × 368 (18 ԿԲ) | Mikael Häggström | {{Information |Description ={{en|1=Pie chart of the incidence of lung cancer types, sorted by histological subtypes, in turn sorted into how many are non-smokers versus smokers - defined as current or former smoker of more than 1 ye |
Նիշքի օգտագործում
Հետևյալ 2 էջերը հղվում են այս նիշքին՝
Նիշքի համընդհանուր օգտագործում
Հետևյալ այլ վիքիները օգտագործում են այս նիշքը՝
- Օգտագործումը ar.wikipedia.org կայքում
- Օգտագործումը bs.wikipedia.org կայքում
- Օգտագործումը el.wikipedia.org կայքում
- Օգտագործումը en.wikipedia.org կայքում
- Օգտագործումը en.wikiversity.org կայքում
- Օգտագործումը ha.wikipedia.org կայքում
- Օգտագործումը he.wikipedia.org կայքում
- Օգտագործումը ko.wikipedia.org կայքում
- Օգտագործումը pl.wikipedia.org կայքում
- Օգտագործումը pt.wikipedia.org կայքում
- Օգտագործումը ru.wikipedia.org կայքում
- Օգտագործումը sh.wikipedia.org կայքում
- Օգտագործումը sv.wikipedia.org կայքում