Պատկեր:CAPspendingbysector.png
Ավելի բարձր կետաչափով տարբերակ չկա։
CAPspendingbysector.png (611 × 382 փիքսել, նիշքի չափը՝ 24 ԿԲ, MIME-տեսակը՝ image/png)

|
Please translate the English parts of this template into Armenian.
Գոյություն ունի այս պատկերի վեկտորային տարբերակը ("SVG"): Եթե այն իր ռաստրային տարբերակից ավելի որակյալ է, ապա գերադասելի է նրա օգտագործումը: File:CAPspendingbysector.png → File:CAPspendingbysector.svg
Վեկտորային գրաֆիկայի մասին ավելին իմանալու համար կարող եք կարդալ պատկերների փոխադրման մասին SVG ֆորմատի: Նաև մատչելի են տեղեկություններ SVG ֆորմատի աջակցման մասին ՄեդիաՎիքիյում: |
 |
Transferred from en.wikipedia to Commons by Maksim.
The original description page was here. All following user names refer to en.wikipedia.
Ամփոփում
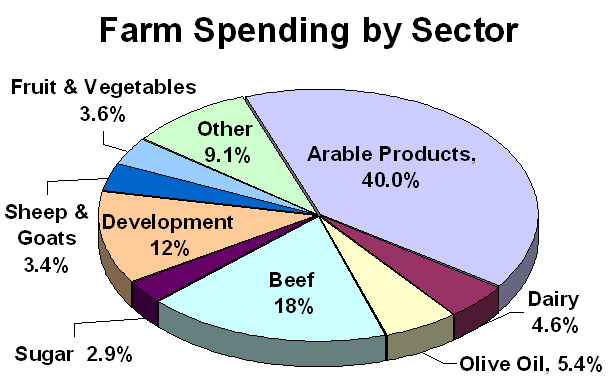
Pie chart showing percentages of CAP expenditure on different agricultural products. Created by me December 2005.
Արտոնագրում
| This work has been released into the public domain by its author, Sandpiper at անգլերեն Վիքիպեդիա. This applies worldwide. In some countries this may not be legally possible; if so: Sandpiper grants anyone the right to use this work for any purpose, without any conditions, unless such conditions are required by law. |
| date/time | username | edit summary |
|---|---|---|
| 21:26, 19 December 2005 | en:User:Sandpiper | (Pie chart showing percentages of CAP expenditure on different agricultural products. Created by me December 2005.) |

|
This image shows some kind of simple graph/chart that could be converted to a Wikichart. Storing graphs or charts as images makes it harder to change (correct or translate) them. Wikicharts also help making sure to be consistent in font and size. |
|
| |
Original upload log
Legend: (cur) = this is the current file, (del) = delete this old version, (rev) = revert to this old version.
Click on date to download the file or see the image uploaded on that date.
- (del) (cur) 21:26, 19 December 2005 . . en:User:Sandpiper Sandpiper ( en:User_talk:Sandpiper Talk) . . 611x382 (24190 bytes) (Pie chart showing percentages of CAP expenditure on different agricultural products. Created by me December 2005.)
Նիշքի պատմություն
Մատնահարեք օրվան/ժամին՝ նիշքի այդ պահին տեսքը դիտելու համար։
| Օր/Ժամ | Մանրապատկեր | Օբյեկտի չափը | Մասնակից | Մեկնաբանություն | |
|---|---|---|---|---|---|
| ընթացիկ | 07:47, 1 Ապրիլի 2006 | | 611 × 382 (24 ԿԲ) | Maksim | La bildo estas kopiita de wikipedia:en. La originala priskribo estas: == Summary == Pie chart showing percentages of CAP expenditure on different agricultural products. Created by me December 2005. == Licensing == {{PD-self}} {| border="1" ! date/time | |
Նիշքի օգտագործում
Հետևյալ էջը հղվում է այս նիշքին՝
Նիշքի համընդհանուր օգտագործում
Հետևյալ այլ վիքիները օգտագործում են այս նիշքը՝
- Օգտագործումը ca.wikipedia.org կայքում
- Օգտագործումը en.wikipedia.org կայքում
- Օգտագործումը eo.wikipedia.org կայքում
- Օգտագործումը ia.wikipedia.org կայքում
- Օգտագործումը ja.wikipedia.org կայքում
- Օգտագործումը nl.wikipedia.org կայքում