Պատկեր:CAPM-SML.svg

Size of this PNG preview of this SVG file: 723 × 578 պիքսել. Այլ թույլտվությաններ: 300 × 240 պիքսել | 601 × 480 պիքսել | 961 × 768 պիքսել | 1280 × 1023 պիքսել | 2560 × 2047 պիքսել.
Սկզբնական նիշք (SVG-նիշք, անվանապես 723 × 578 փիքսել, նիշքի չափը՝ 11 ԿԲ)
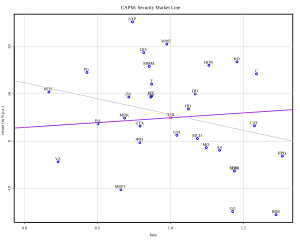
| Նկարագրում | dow jones index and it's 30 stocks: the CAPM and the security market line (purple). the grey line is the linear model. mean yield is assumed to be 2.9% |
| Թվական | |
| Աղբյուր | data by quote.yahoo, atomatically retrieved with GNU R, see graph source below |
| Հեղինակ | Thomas Steiner |
| Իրավունքներ (Նիշքի վերաօգտագործումը) |
Thomas Steiner put it under the CC-by-SA 2.5. |
This file is licensed under the Creative Commons Attribution-Share Alike 2.5 Generic license.
- Դուք ազատ եք՝
- կիսվել ստեղծագործությամբ – պատճենել, տարածել և փոխանցել այս աշխատանքը։
- վերափոխել – ադապտացնել աշխատանքը
- Պահպանելով հետևյալ պայմանները'
- հղում – Դուք պետք է նշեք հեղինակի (իրավատիրոջ) հղումը:
- համանման տարածում – Եթե դուք ձևափոխում եք, փոխակերպում, կամ այս աշխատանքի հիման վրա ստեղծում եք նոր աշխատանք, ապա ձեր ստեղծածը կարող է տարածվել միայն նույն կամ համարժեք թույլատրագրով։
R source:
library(tseries)
library(RSvgDevice)

quote<-function(inst, nDs) {
  if(!inherits(try(open(url("http://quote.yahoo.com")), silent = TRUE), "try-error")) {
    start <- strftime(as.POSIXlt(Sys.time() - nDs*24*3600), format="%Y-%m-%d")
    end <- strftime(as.POSIXlt(Sys.time()), format = "%Y-%m-%d")
    x <- get.hist.quote(instrument=inst, start=start, end=end, quote = c("AdjClose"), compression="m",  quiet=T, retclass="zoo")
  }
  return(x)
}

yield=2.9
nDays=1042
comp<-c("^DJI", "AA", "AIG", "AXP", "BA", "C", "CAT", "DD", "DIS", "GE", "GM", "HD", "HON", "HPQ", "IBM", "INTC", "JNJ", "JPM", "KO", "MCD", "MMM", "MO", "MRK", "MSFT", "PFE", "PG", "T", "UTX", "VZ", "WMT", "XOM")

comp.quote<-quote(comp[1],nDays)
from= as.Date(index(comp.quote[1,1]),format="%Y-%m-%d")
to=   as.Date(index(comp.quote[length(comp.quote[,1]),1]),format="%Y-%m-%d")

for (c in 2:length(comp)) {
  comp.quote<-merge(comp.quote,quote(comp[c],nDays))
}

rdt<-12*diff(comp.quote)/comp.quote*100

points=array(NA,dim=c(length(comp),2))
for (p in 1:length(comp)) {
  points[p,1]= cov(rdt[,1],rdt[,p])/var(rdt[,1])
  points[p,2]=mean(rdt[,p])
}

devSVG(file="CAPM-SML.svg", width=10, height=8, bg="transparent", fg="black", onefile=TRUE, xmlHeader=TRUE)

par(lwd=2)
plot(points[2:length(comp),],type="p",col="blue",xlab="beta",ylab="return (in % p.a.)",main="CAPM: Security Market Line",xlim=range(0,points[,1]))
lines(points[1,1],points[1,2],col="red",type="p")
abline(a=yield,b=points[1,2]-yield,col="purple")
text(points[2:length(comp),1],points[2:length(comp),2],comp,pos=3,col="blue")
text(points[1,1],             points[1,2],           comp[1],pos=3,col="red")

lm1<-lm(points[,2]~points[,1])
abline(lm1,col="darkgrey",lwd=1)

text(x=par("usr")[2], y=par("usr")[3]+0.5, labels=paste("Dow Jones monthly data from", format.Date(from,"%d %b %Y"), "to", format.Date(to,"%d %b %Y"),""), col="grey",adj=c(1,0) )
grid(lwd=1)

dev.off()
Սա վեկտոր գրաֆիկական պատկեր է ստեղծված է եղել R օգնությամբ: .
Նիշքի պատմություն
Մատնահարեք օրվան/ժամին՝ նիշքի այդ պահին տեսքը դիտելու համար։
| Օր/Ժամ | Մանրապատկեր | Օբյեկտի չափը | Մասնակից | Մեկնաբանություն | |
|---|---|---|---|---|---|
| ընթացիկ | 14:08, 8 Նոյեմբերի 2006 | | 723 × 578 (11 ԿԲ) | Thire | {{Information| |Description = dow jones index and it's 30 stocks: the CAPM and the security market line (purple). the grey line is the linear model. mean yield is assumed to be 2.9% |Source = data by quote.yahoo, atomatically retrieved with GNU R, see gra |
Նիշքի օգտագործում
Հետևյալ էջը հղվում է այս նիշքին՝
Նիշքի համընդհանուր օգտագործում
Հետևյալ այլ վիքիները օգտագործում են այս նիշքը՝
- Օգտագործումը de.wikibooks.org կայքում
- Օգտագործումը en.wikipedia.org կայքում
- Օգտագործումը en.wikibooks.org կայքում
- Օգտագործումը fa.wikipedia.org կայքում
- Օգտագործումը he.wikipedia.org կայքում
- Օգտագործումը he.wiktionary.org կայքում
- Օգտագործումը hi.wikipedia.org կայքում
- Օգտագործումը nl.wikipedia.org կայքում
- Օգտագործումը pt.wikipedia.org կայքում
- Օգտագործումը ru.wikipedia.org կայքում